Technology for Event-Based Data
dVXAnalytics helps analysts work with temporal, event-based data.
It enables an analyst to interact with data both visually and quantitatively.
The tight visual connection means that results are easier to
understand and explain to others.
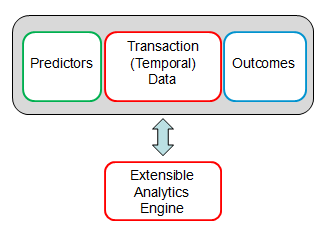
dVXAnalytics Work Flow
An example analytic task is the development of a model based on a set of predictors.
The diagram shown above depicts the high-level view of the display and workflow.
To generate the model, the analyst uses graphical objects to assign examples to
training and test groups. The analytical engine then uses these examples to create
the predictive model. Model output and accuracy is viewed in the outcomes section of the display.
Predictors are ranked in order of their level of contribution to the classified output.
Request the Demo
The system is highly interactive and is best demonstrated during our Webex demos.
We invite you to request a demonstration.
Request a demo
|