Using dVXAnalytics: a high-level example
The analyst uses dVXAnalytics via a graphical user interface.
In a typical example,
an analyst may wish to create a model of customer attrition based on transaction
histories.
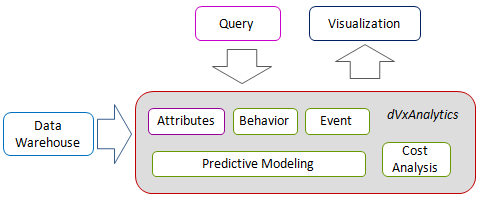
Attributes, behaviors and events
dVXAnalytics thinks in terms of attributes, behaviors
and events. In this example, the event of interest is
customer attrition (day of last purchase) and the decision rules are based on
patterns in their transaction behaviors and demographic attributes.
Correlations and profit: dVXAnalytics does the heavy-lifting
The power of dVXAnalytics is that it does hard work of organizing and transforming data
as the analyst performs queries.
For example, the analyst defines an event of interest: attrition.
dVXAnalytics aligns the data structures and displays the
result, showing correlations and patterns that anticipate the attrition 'event'.
Analytic productivity
The analyst works more efficiently because they apply their energy directly to
solving the problem.
dVXAnalytics lights the way by showing correlations and does the
hard work of preparing and analyzing the data.
Try doing that with a pie-chart!
We love giving demos! Here's what you'll see.
|